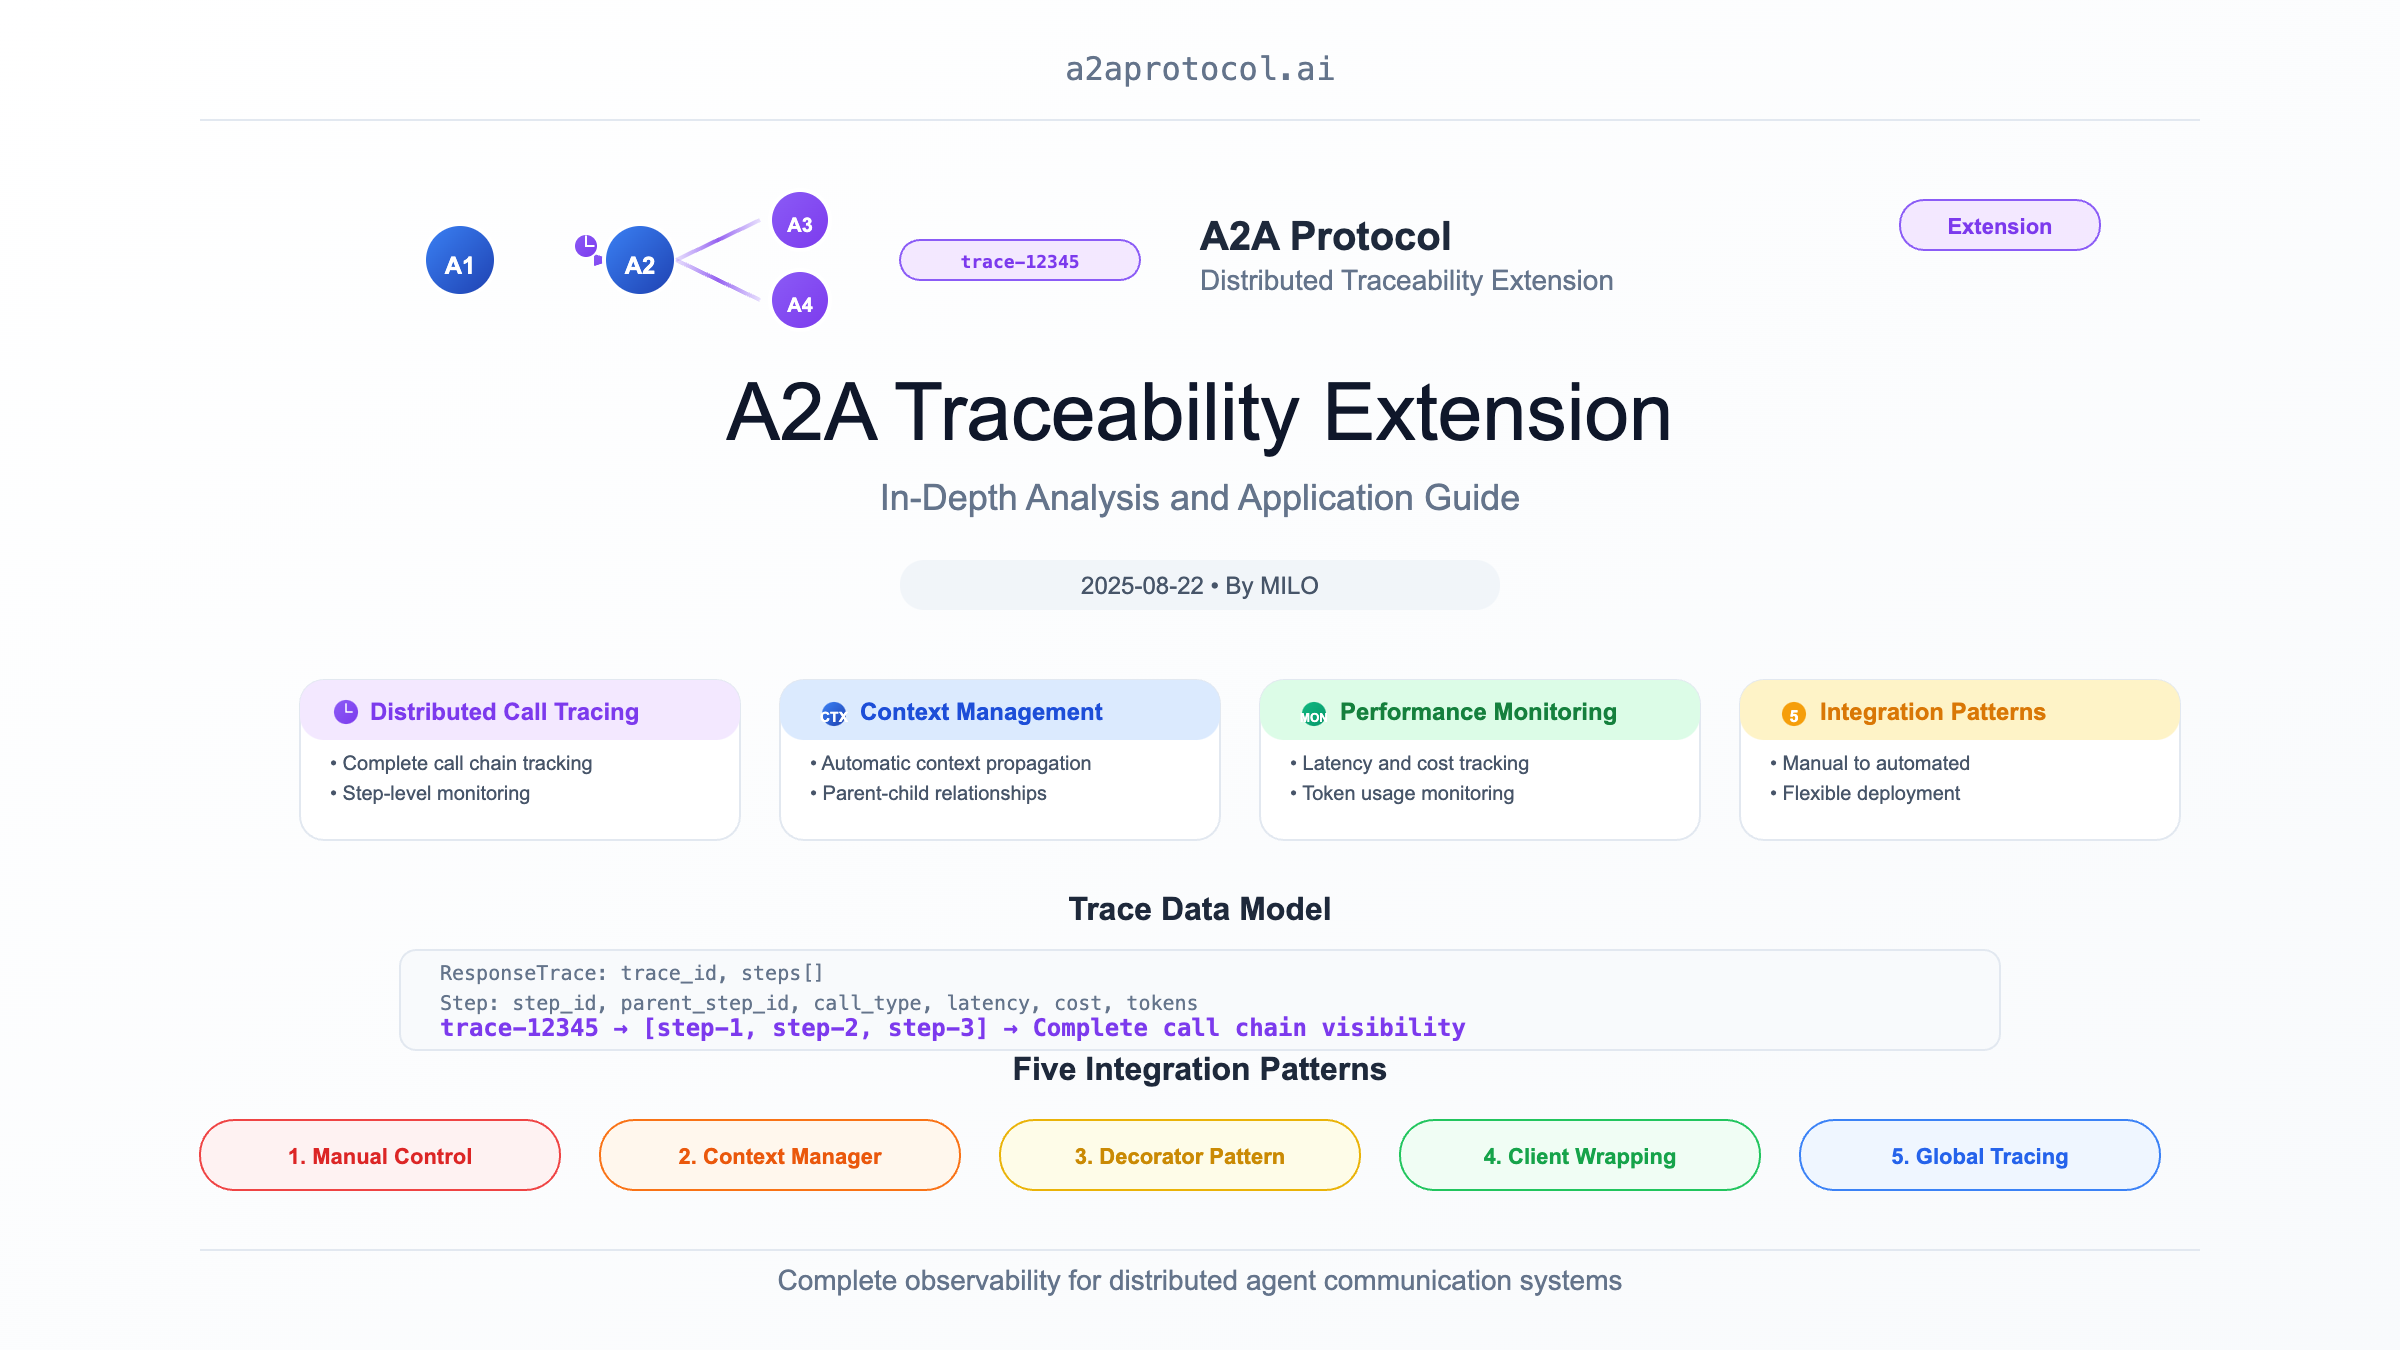
A2A Traceability Extension: In-depth Analysis and Application Guide
Overview
The A2A (Agent2Agent) Traceability Extension is a powerful distributed tracing system specifically designed to provide complete call chain tracing for agent-to-agent communication in the A2A framework. This extension implements functionality similar to distributed tracing systems (such as Jaeger, Zipkin), but is optimized for the specific needs of multi-agent systems.
Core Features
1. Distributed Call Tracing
- Complete Call Chain: Records the complete call paths and dependencies between agents
- Step-level Monitoring: Tracks detailed information for each operation step
- Nested Tracing: Supports complex nested calls and recursive scenarios
- Performance Monitoring: Collects key metrics like latency, cost, and token usage
2. Intelligent Context Management
- Automatic Context Propagation: Automatically passes tracing context through agent call chains
- Parent-Child Relationship Maintenance: Accurately records the hierarchical structure of calls
- Error Propagation: Tracks error propagation paths through the call chain
3. Diverse Integration Approaches
- Context Managers: Simplify tracing code with
TraceStep - Decorator Pattern: Provides transparent tracing functionality integration
- Manual Control: Complete control over tracing lifecycle
Design Principles
Architecture Patterns
The extension adopts core design patterns from modern distributed tracing systems:
-
Layered Tracing Model:
- Trace: Represents a complete business operation
- Step: Individual operation unit within a trace
- Context: Tracing information passed through the call chain
-
Observer Pattern: Automatically collects tracing data through context managers
-
Strategy Pattern: Supports different tracing strategies and configurations
Data Model
ResponseTrace
class ResponseTrace:
    trace_id: str          # Unique trace identifier
    steps: List[Step]      # List of trace steps
Step
class Step:
    step_id: str           # Unique step identifier
    trace_id: str          # Belonging trace ID
    parent_step_id: str    # Parent step ID
    call_type: CallTypeEnum # Call type (AGENT/TOOL/HOST)
    start_time: datetime   # Start time
    end_time: datetime     # End time
    latency: int          # Latency (milliseconds)
    cost: float           # Operation cost
    total_tokens: int     # Token usage
    error: Any            # Error information
Core Problems Solved
1. Observability in Multi-Agent Systems
In complex multi-agent systems, a user request may trigger collaboration between multiple agents:
User Request -> Coordinator Agent -> Data Agent -> Analysis Agent -> Decision Agent -> Execution Agent
Problems without tracing:
- Cannot understand the complete flow path of requests through the system
- Difficult to locate performance bottlenecks and failure points
- Lack of end-to-end performance monitoring
- Unable to perform effective system optimization
2. Cost and Performance Monitoring for Agent Calls
Modern AI agents typically involve expensive LLM calls:
# Without tracing, cannot answer:
# - How much did this conversation cost in total?
# - Which agent consumed the most tokens?
# - Where are the performance bottlenecks?
user_query -> agent_a -> llm_call(cost=$0.05, tokens=1000)
           -> agent_b -> llm_call(cost=$0.08, tokens=1500)
           -> agent_c -> tool_call(latency=2000ms)
3. Error Propagation and Fault Diagnosis
When an error occurs in the agent chain, rapid problem localization is needed:
# With tracing, you can clearly see:
Trace ID: trace-12345
├── Step 1: UserQuery (success, 10ms)
├── Step 2: DataAgent (success, 200ms, $0.05)
├── Step 3: AnalysisAgent (failed, 1500ms, error: "API timeout")
└── Step 4: DecisionAgent (skipped due to upstream failure)
4. Business Process Optimization
Analyze business process efficiency through tracing data:
# Analysis of tracing data reveals:
# - 80% of latency comes from database queries in the data agent
# - Parallel processing in the analysis agent can reduce total time by 50%
# - Some tool calls can be cached to reduce costs
Technical Implementation Details
1. Context Manager Pattern
class TraceStep:
    """Context manager that automatically manages trace step lifecycle"""

    def __enter__(self) -> TraceRecord:
        # Start tracing, record start time
        return self.step

    def __exit__(self, exc_type, exc_val, exc_tb):
        # End tracing, record end time and error information
        self.step.end_step(error=error_msg)
        if self.response_trace:
            self.response_trace.add_step(self.step)
Usage Example:
with TraceStep(trace, CallTypeEnum.AGENT, name="Data Query") as step:
    result = await data_agent.query(params)
    step.end_step(cost=0.05, total_tokens=1000)
2. Automated Tracing Integration
# Transparent integration, no need to modify business code
original_client = AgentClient()
traced_client = ext.wrap_client(original_client)

# All calls through traced_client are automatically traced
response = await traced_client.call_agent(request)
3. Extension Activation Mechanism
Tracing is activated through HTTP headers:
X-A2A-Extensions: https://github.com/a2aproject/a2a-samples/extensions/traceability/v1
Five Integration Patterns
Pattern 1: Full Manual Control
Developers have complete control over trace creation and management:
ext = TraceabilityExtension()
trace = ResponseTrace()
step = TraceRecord(CallTypeEnum.AGENT, name="User Query")
# ... business logic ...
step.end_step(cost=0.1, total_tokens=500)
trace.add_step(step)
Use Case: Advanced scenarios requiring precise control over tracing granularity and content
Pattern 2: Context Manager
Use context managers to simplify tracing code:
with TraceStep(trace, CallTypeEnum.TOOL, name="Database Query") as step:
    result = database.query(sql)
    step.end_step(cost=0.02, additional_attributes={"rows": len(result)})
Use Case: Precise tracing within specific code blocks
Pattern 3: Decorator Automation
Implement transparent tracing through decorators:
@trace_agent_call
async def process_request(request):
    # All agent calls are automatically traced
    return await some_agent.process(request)
Use Case: Scenarios requiring minimal code modification
Pattern 4: Client Wrapping
Wrap existing clients to add tracing functionality:
traced_client = ext.wrap_client(original_client)
# All calls automatically include tracing information
Use Case: Non-invasive integration with existing systems
Pattern 5: Global Tracing
Enable global tracing at the executor level:
traced_executor = ext.wrap_executor(original_executor)
# All operations through the executor are traced
Use Case: Production environments requiring system-wide tracing coverage
Real-world Application Scenarios
1. Intelligent Customer Service System Tracing
# Complete customer service processing flow tracing
with TraceStep(trace, CallTypeEnum.AGENT, "Customer Service Processing") as main_step:

    # Intent recognition
    with TraceStep(trace, CallTypeEnum.AGENT, "Intent Recognition", parent_step_id=main_step.step_id) as intent_step:
        intent = await intent_agent.classify(user_message)
        intent_step.end_step(cost=0.02, total_tokens=200)

    # Knowledge retrieval
    with TraceStep(trace, CallTypeEnum.TOOL, "Knowledge Retrieval", parent_step_id=main_step.step_id) as kb_step:
        knowledge = await knowledge_base.search(intent)
        kb_step.end_step(latency=150, additional_attributes={"results": len(knowledge)})

    # Response generation
    with TraceStep(trace, CallTypeEnum.AGENT, "Response Generation", parent_step_id=main_step.step_id) as gen_step:
        response = await response_agent.generate(intent, knowledge)
        gen_step.end_step(cost=0.08, total_tokens=800)

    main_step.end_step(cost=0.10, total_tokens=1000)
2. Financial Risk Control System Monitoring
# Complete tracing chain for risk control decisions
trace = ResponseTrace("Risk Assessment-" + transaction_id)

with TraceStep(trace, CallTypeEnum.AGENT, "Risk Assessment") as risk_step:

    # User profiling analysis
    with TraceStep(trace, CallTypeEnum.AGENT, "User Profiling") as profile_step:
        user_profile = await profile_agent.analyze(user_id)
        profile_step.end_step(cost=0.05, additional_attributes={"risk_score": user_profile.risk})

    # Transaction pattern analysis
    with TraceStep(trace, CallTypeEnum.AGENT, "Transaction Analysis") as pattern_step:
        pattern_analysis = await pattern_agent.analyze(transaction)
        pattern_step.end_step(cost=0.03, additional_attributes={"anomaly_score": pattern_analysis.anomaly})

    # Final decision
    decision = risk_engine.decide(user_profile, pattern_analysis)
    risk_step.end_step(
        cost=0.08,
        additional_attributes={
            "decision": decision.action,
            "confidence": decision.confidence
        }
    )
Performance Monitoring and Analysis
Trace Data Analysis
def analyze_trace_performance(trace: ResponseTrace):
    """Analyze trace performance data"""

    total_cost = sum(step.cost or 0 for step in trace.steps)
    total_tokens = sum(step.total_tokens or 0 for step in trace.steps)
    total_latency = max(step.end_time for step in trace.steps) - min(step.start_time for step in trace.steps)

    # Identify performance bottlenecks
    bottleneck = max(trace.steps, key=lambda s: s.latency or 0)

    # Cost analysis
    cost_by_type = defaultdict(float)
    for step in trace.steps:
        cost_by_type[step.call_type] += step.cost or 0

    return {
        "total_cost": total_cost,
        "total_tokens": total_tokens,
        "total_latency": total_latency.total_seconds() * 1000,
        "bottleneck": f"{bottleneck.name} ({bottleneck.latency}ms)",
        "cost_distribution": dict(cost_by_type)
    }
Real-time Monitoring Dashboard
class TracingDashboard:
    """Real-time tracing monitoring dashboard"""

    def __init__(self):
        self.active_traces = {}
        self.completed_traces = []

    def update_trace(self, trace: ResponseTrace):
        """Update trace status"""
        self.active_traces[trace.trace_id] = trace

        # Check if completed
        if self.is_trace_completed(trace):
            self.completed_traces.append(trace)
            del self.active_traces[trace.trace_id]
            self.analyze_completed_trace(trace)

    def get_real_time_metrics(self):
        """Get real-time metrics"""
        return {
            "active_traces": len(self.active_traces),
            "completed_traces": len(self.completed_traces),
            "average_latency": self.calculate_average_latency(),
            "cost_trend": self.calculate_cost_trend(),
            "error_rate": self.calculate_error_rate()
        }
Best Practices
1. Appropriate Tracing Granularity
# ✅ Good practice: Key business operations
with TraceStep(trace, CallTypeEnum.AGENT, "Order Processing"):
    process_order(order)

# ❌ Avoid: Too fine-grained tracing
with TraceStep(trace, CallTypeEnum.TOOL, "Variable Assignment"):  # Too granular
    x = y + 1
2. Meaningful Step Naming
# ✅ Clear business semantics
with TraceStep(trace, CallTypeEnum.AGENT, "User Authentication") as step:

# ✅ Include key parameters
with TraceStep(trace, CallTypeEnum.TOOL, f"Database Query-{table_name}") as step:

# ❌ Technical implementation details
with TraceStep(trace, CallTypeEnum.TOOL, "SQL SELECT Statement Execution") as step:
3. Proper Error Handling
with TraceStep(trace, CallTypeEnum.AGENT, "External API Call") as step:
    try:
        result = await external_api.call()
        step.end_step(
            cost=calculate_cost(result),
            additional_attributes={"status": "success"}
        )
    except ApiException as e:
        step.end_step(
            error=str(e),
            additional_attributes={"status": "failed", "error_code": e.code}
        )
        raise
4. Sensitive Information Protection
# ✅ Safe parameter recording
with TraceStep(trace, CallTypeEnum.AGENT, "User Authentication",
               parameters={"user_id": user.id}) as step:  # Only record ID

# ❌ Avoid recording sensitive information
with TraceStep(trace, CallTypeEnum.AGENT, "User Authentication",
               parameters={"password": user.password}) as step:  # Dangerous!
Integration with Other Systems
1. Logging System Integration
import logging

class TracingLogHandler(logging.Handler):
    """Integrate tracing information into logging system"""

    def emit(self, record):
        if hasattr(record, 'trace_id'):
            record.msg = f"[trace:{record.trace_id}] {record.msg}"
        super().emit(record)
2. Monitoring System Integration
class PrometheusTraceExporter:
    """Export trace metrics to Prometheus"""

    def export_trace(self, trace: ResponseTrace):
        # Export latency metrics
        latency_histogram.observe(trace.total_latency)

        # Export cost metrics
        cost_gauge.set(trace.total_cost)

        # Export error rate
        if trace.has_errors:
            error_counter.inc()
Summary
The A2A Traceability Extension provides enterprise-level distributed tracing capabilities for multi-agent systems, addressing observability challenges in complex agent networks. It not only provides technical implementation but, more importantly, establishes standard patterns for monitoring and optimizing multi-agent systems.
Core Value:
- Complete Visibility: Provides end-to-end visibility into agent call chains
- Performance Optimization: Supports system optimization through detailed performance data
- Fault Diagnosis: Rapidly locates and resolves issues in distributed systems
- Cost Control: Accurately tracks and optimizes AI agent usage costs
Design Advantages:
- Flexible Integration: Multiple integration approaches from manual to automatic
- Standardization: Follows industry standards for distributed tracing
- High Performance: Minimal performance impact on business code
- Extensible: Supports custom attributes and extended functionality
This extension provides a solid foundation for building reliable, monitorable, and optimizable multi-agent systems, serving as an important component of modern AI system engineering practices.
Other Extensions
Featured Products
Tools and services from the A2A ecosystem directory.

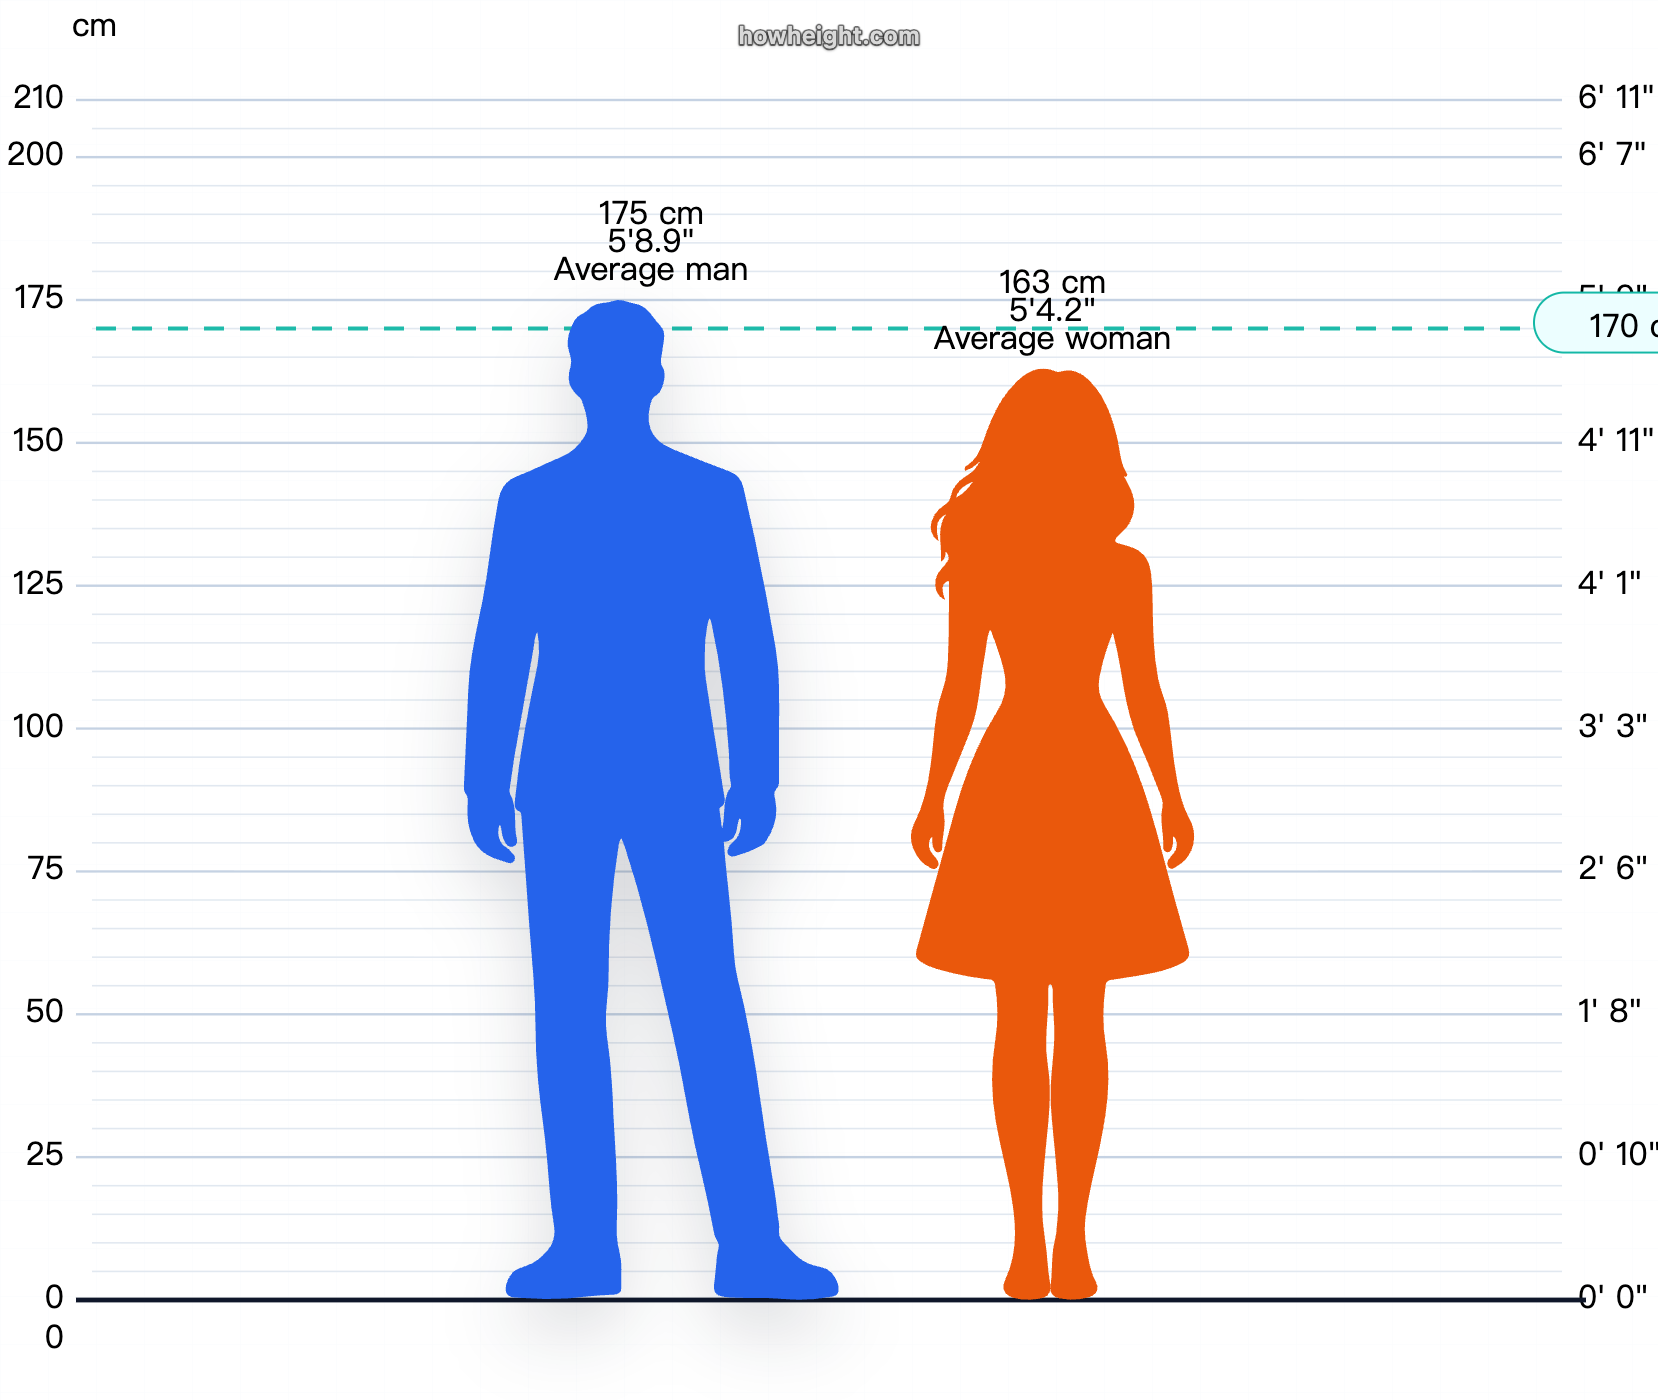
HowHeight is the most powerful free visual height comparison tool for people, animals, objects, and characters, with charts in cm and ft + in.

Turn complex PDFs into clean Markdown that people can review and AI tools can use.
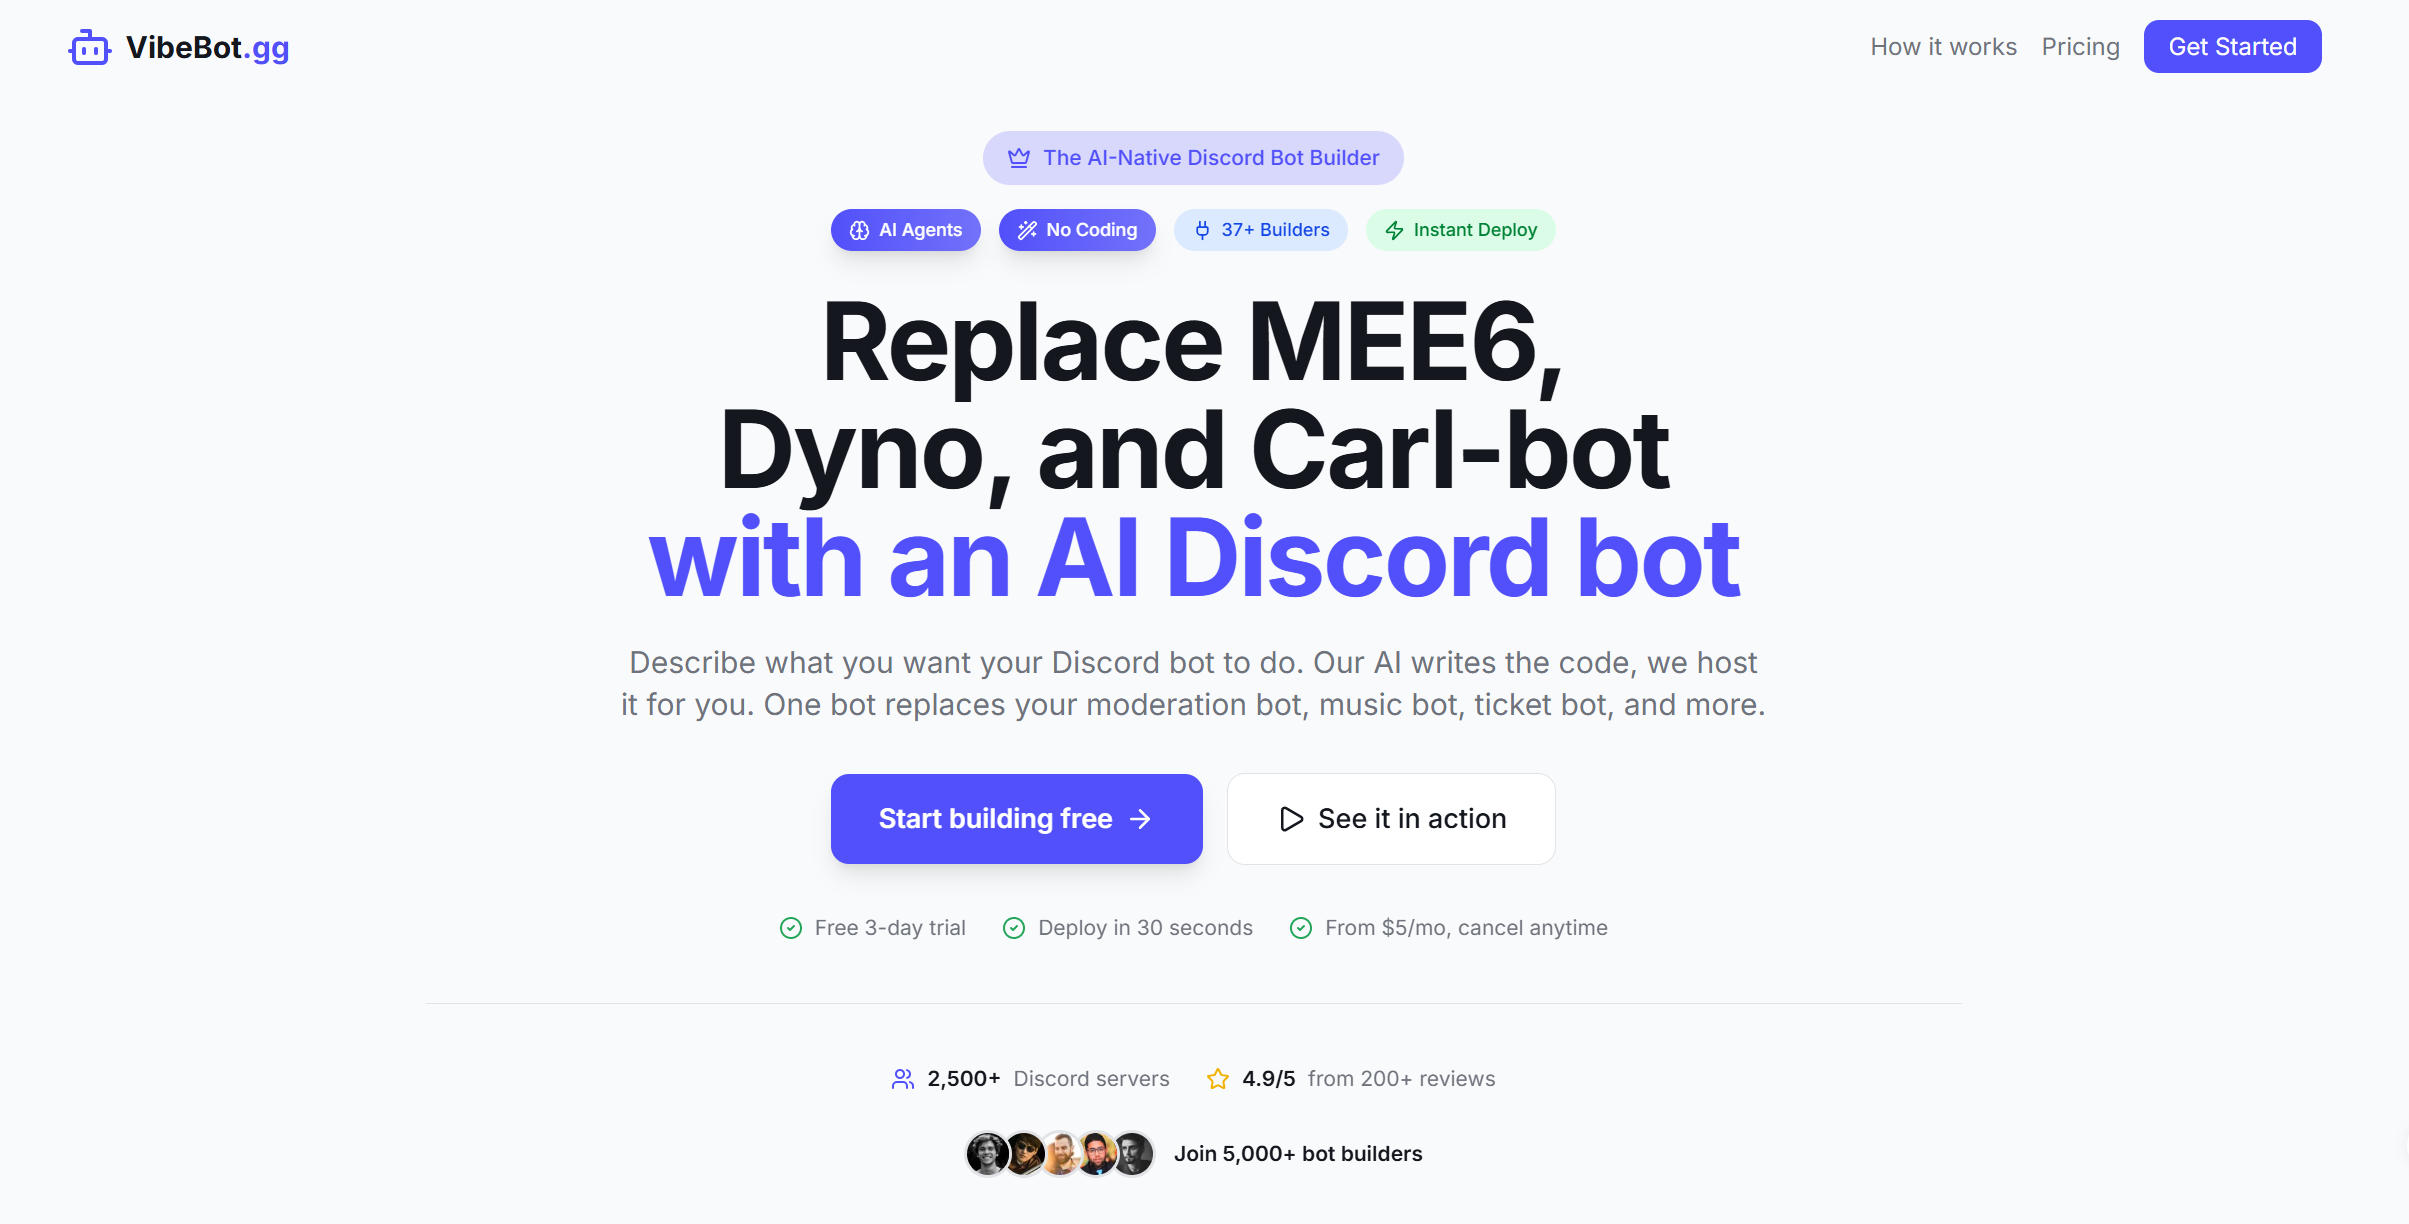
Create powerful Discord bots with AI. The easiest no-code bot maker for moderation, music, leveling, and custom commands.
Related Articles
Explore more content related to this topic
A2A Timestamp Extension: In-Depth Analysis and Application Guide
A2A timestamp extension analysis and application guide
A2A Protocol Extension: Secure Passport Complete Guide
The Secure Passport Extension introduces a trusted context layer to the Agent2Agent (A2A) protocol, enabling calling agents to securely and voluntarily share a structured subset of their current context state with called agents. This extension aims to transform anonymous, transactional calls into collaborative partnerships.
Agent Gateway Protocol (AGP): Practical Tutorial and Specification
Learn the Agent Gateway Protocol (AGP): what it is, problems it solves, core spec (capability announcements, intent payloads, routing and error codes), routing algorithm, and how to run a working simulation.
A2A vs ACP Protocol Comparison Analysis Report
A2A (Agent2Agent Protocol) and ACP (Agent Communication Protocol) represent two mainstream technical approaches in AI multi-agent system communication: 'cross-platform interoperability' and 'local/edge autonomy' respectively. A2A, with its powerful cross-vendor interconnection capabilities and rich task collaboration mechanisms, has become the preferred choice for cloud-based and distributed multi-agent scenarios; while ACP, with its low-latency, local-first, cloud-independent characteristics, is suitable for privacy-sensitive, bandwidth-constrained, or edge computing environments. Both protocols have their own focus in protocol design, ecosystem construction, and standardization governance, and are expected to further converge in openness in the future. Developers are advised to choose the most suitable protocol stack based on actual business needs.
A2A vs MCP Protocol Relationship: In-Depth Community Discussion Analysis
Comprehensive analysis of A2A vs MCP protocol relationship based on GitHub community discussions. Explores design philosophy differences, ecosystem maturity, and practical guidance for choosing between agent-to-agent communication vs tool standardization approaches.